Explore Interesting Stories About Forex Position Trading Keltner, Keltner Channels Explained: Keltner Channels vs Bollinger Bands 📈.
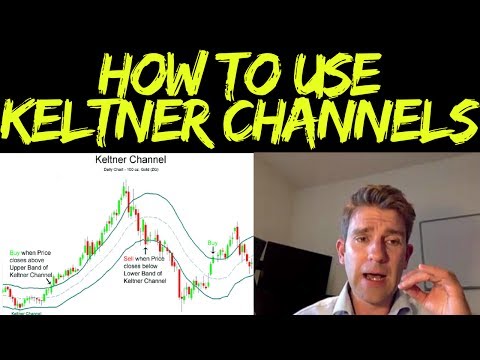
Keltner Channels Explained. http://www.financial-spread-betting.com/course/technical-analysis.html PLEASE LIKE AND SHARE THIS VIDEO SO WE CAN DO MORE! If you just looked at the last lesson about Bollinger bands, the chart using Keltner channels will look very familiar. Both types of indicator are used in generally the same way. But it is important to note the differences because they can be significant.
You’ll notice that the Bollinger bands, which are based on two times the standard deviation, tend to open and close fairly readily. On the other hand, Keltner channels use the ATR (generally a value of two times ATR) to position the high and low level boundaries, and therefore don’t seem to fluctuate so wildly.
While the Bollinger bands contain about 95% of all price movement, Keltner channels don’t work in this way. In fact you will see the price outside the channel fairly frequently. Because of this, you may need to be more subjective in picking your trades.
However some of the same principles apply in using Keltner channels as do for Bollinger bands. In a trending market, you can expect the price to stay to one side of the middle line – above it in an uptrend and below it in a downtrend. As mentioned, the price will go past the upper and lower channel lines, so these aren’t so readily used as constraints when considering the price action.
In an uptrend, the principle of looking to go long when the price dips to the midline, and of scaling out of your position when the price reaches the upper channel line is common to both indicators. Similarly, go short in a downtrend when the price touches the middle line and consider closing the position when it reaches the boundary lower line. That is the way that many traders use the Keltner and Bollinger indicators to enhance their trading.
You’ll also find that some traders put both sets of channels on the same chart, and play off the differences between them. It can be informative to do this when you’re learning to trade using these channels, because it highlights the differences that you need to be aware of when choosing which to use on a regular basis.
For those who prefer things neat and contained, Bollinger bands may be a preference, with their much more tight action around the price. But you will find many traders who believe that Keltner channels give them the edge, and prefer the smoother action and less volatility in the indicator.
Finally, you can also experiment with increasing the distance of the channels from the middle line. All charting software allows you to set your own parameters, and some traders prefer to use three times ATR on the Keltner channels. As demonstrated in the video, increasing the width of the channels this much allows most of the price action to be constrained within the boundaries. Inevitably, this is a trade-off, because by having a wider channel you will have fewer touches of the outer bands and therefore less signals to trade. As with all trading analysis techniques, you should experiment and find out what works best for you.
Related Videos
Trading Confluence for High Probability Trades
How to Use Bollinger Bands to Pinpoint Support and Resistance Levels
How to Use Bollinger Bands and Keltner Channels in Your Trading
Keltner Channels Explained: Keltner Channels vs Bollinger Bands 📈
Keltner Channel Breakout Strategy
Bollinger Bands and Stochastic Reversal Trading Strategy 💡
Profiting from the Bollinger Band Squeeze Strategy 🤛
Short-Term Bollinger Bands Bounce Trading Strategy ⛹🏽♂️
Bollinger Bands Pivot Confluence Trade 💡
What do Bollinger Bands Tell You? Buy or Sell Outside a Bollinger Band!? 📈
https://www.youtube.com/watch?v=Bj_T2VvZpjo
Forex Position Trading Keltner, Keltner Channels Explained: Keltner Channels vs Bollinger Bands 📈.
The Forex Trading Setting Method
Over the last year and also a half, there have been some terrific fads, a lot of visibly short JPY first, and afterwards the recent long USD pattern. In these problems, a lot of traders begin to question why they are not making the kinds of professions where victors are left to compete weeks or even months, accumulating hundreds of pips in earnings in the process. This sort of lasting trading is known as “placement” trading. Investors that are used to shorter-term professions tend to discover this design of trading a terrific obstacle. That is an embarassment, because it typically the most convenient and also most rewarding sort of trading that is offered to retail Forex traders. Here I’ll outline a technique with rather basic policies that simply uses a couple of signs that you can make use of to try to capture and also hold the strongest, longest Forex fads.
Pick the Getting Currencies to Profession
Pick the Currencies to Profession. You require to discover which currencies have been getting over recent months, and also which have been falling. A great duration to make use of for measurement is about 3 months, and also if this remains in the same direction as the longer-term pattern such as 6 months, that is great. One basic method to do this is set a 12 duration RSI and also scan the weekly graphes of the 28 largest currency pairs each weekend break. By keeping in mind which currencies are above or below 50 in all or almost all of their pairs and also crosses, you can get an idea of which pairs you must be trading throughout the coming week. The idea, essentially, is “buy what’s currently been rising, sell what’s currently been going down”. It is counter-intuitive, but it works.
How Many Currency Sets to Profession?
You must now have between one and also four currency pairs to trade. You do not require to try to trade too many pairs.
Establish Charts for perpetuity Frames
Establish graphes on D1, H4, H1, M30, M15, M5 and also M1 period. Mount the 10 duration RSI, the 5 duration EMA and also the 10 duration SMA. You are looking to enter trades in the direction of the pattern when these signs align in the same direction as that pattern on ALL DURATIONS throughout energetic market hours. That indicates the RSI being above the 50 degree for longs or below that degree for shorts. Regarding the moving standards, for a lot of pairs, this would certainly be from 8am to 5pm London time. If both currencies are North American, you might expand this to 5pm New York time. If both currencies are Oriental, you might also search for professions throughout the Tokyo session.
Choose Account Portion to Threat on each Profession
Choose what portion of your account you are mosting likely to run the risk of on each profession. Generally it is best to run the risk of less than 1%. Determine the cash money quantity you will certainly run the risk of and also separate it by the Ordinary True Series of the last 20 days of both you will trade. This is how much you must run the risk of per pip. Keep it consistent.
20 Day Ordinary True Array Away
Go into the profession according to 3), and also put a difficult stop loss on 20 day Ordinary True Array Away from your entrance price. Now you must patiently view and also wait.
Positive-Looking Candle Holder Pattern in the Desired Direction
If the profession actions against you rapidly by around 40 pips and also shows no indications of returning, departure by hand. If this does not take place, wait a couple of hours, and also inspect once again at the end of the trading day. If the profession is showing a loss right now, and also is not making a positive-looking candle holder pattern in the wanted direction, after that exit the profession by hand.
Backtrack Back to Your Entry Point
If the profession remains in your favour at the end of the day, after that view and also wait for it to backtrack back to your entrance point. If it does not bounce back once again within a couple of hours of reaching your entrance point, exit the profession by hand.
Profession Degree of Revenue Double to Tough Stop Loss
This must proceed till either your profession gets to a level of earnings dual your hard stop loss. At this moment, move the stop to break even.
Move the Stop-Up under Assistance or Resistance
As the profession relocates a growing number of in your favour, move the block under assistance or resistance as appropriate to the direction of your profession. Ultimately you will certainly be quit out, but in an excellent pattern the profession must make thousands or a minimum of numerous pips.
You can customize this strategy a little according to your choices. Nonetheless, whatever you do, you will certainly shed the majority of the professions, and also you will certainly experience long periods where there are no professions which is dull or where every profession is a loss or recover cost. There will certainly be irritating moments and also challenging durations. Nevertheless, you are bound to make money in the long run if you follow this sort of trading strategy, because it follows the timeless principles of robust, successful trading:
Cut your shedding professions short.
Let your winning professions run.
Never run the risk of excessive on a solitary profession.
Size your placements according to the volatility of what you are trading.
Trade with the pattern.
Do not stress over capturing the first sector of a fad, or its last. It is the part between that is both secure and also rewarding sufficient.
Explore Interesting Stories About Forex Position Trading Keltner and Financial market news, evaluation, trading signals and also Forex mentor testimonials.
Please Note:
The info offered by TradingForexGuide.com (TFG) is for general informational and also educational objectives just. It is not intended and also must not be taken to constitute recommendations. If such info is acted on by you after that this must be entirely at your discretion and also TradingForexGuide.com (TFG) will certainly not be held accountable and also accountable at all.